 Data visualization uses uncomplicated language to simplify things into concepts that can be easily grasped in graphical format enabling easy understanding. It also can provide insight and ability to understand cross-cutting complex issues and identify patterns to inform formation of successful decision making in terms of strategies and solutions. Prior to the use of the current formal written language, pictures (a form of visualization) were the key medium for sharing history, plans and ideas. Recognising the immense importance of data visualization, CODATA Kenya and the ICT centre of Open Data (iCEOD) under the leadership of its Director Prof. Muliaro Wafula in Jomo Kenyatta University of Agriculture and Technology, who is also the Chair of CODATA Kenya and an elected member of the CODATA International Executive Committee, organised the first Data, Information and Scientific Visualization Symposium in Afriuca that was held from 20-21 August 2018 in Nairobi, Kenya.
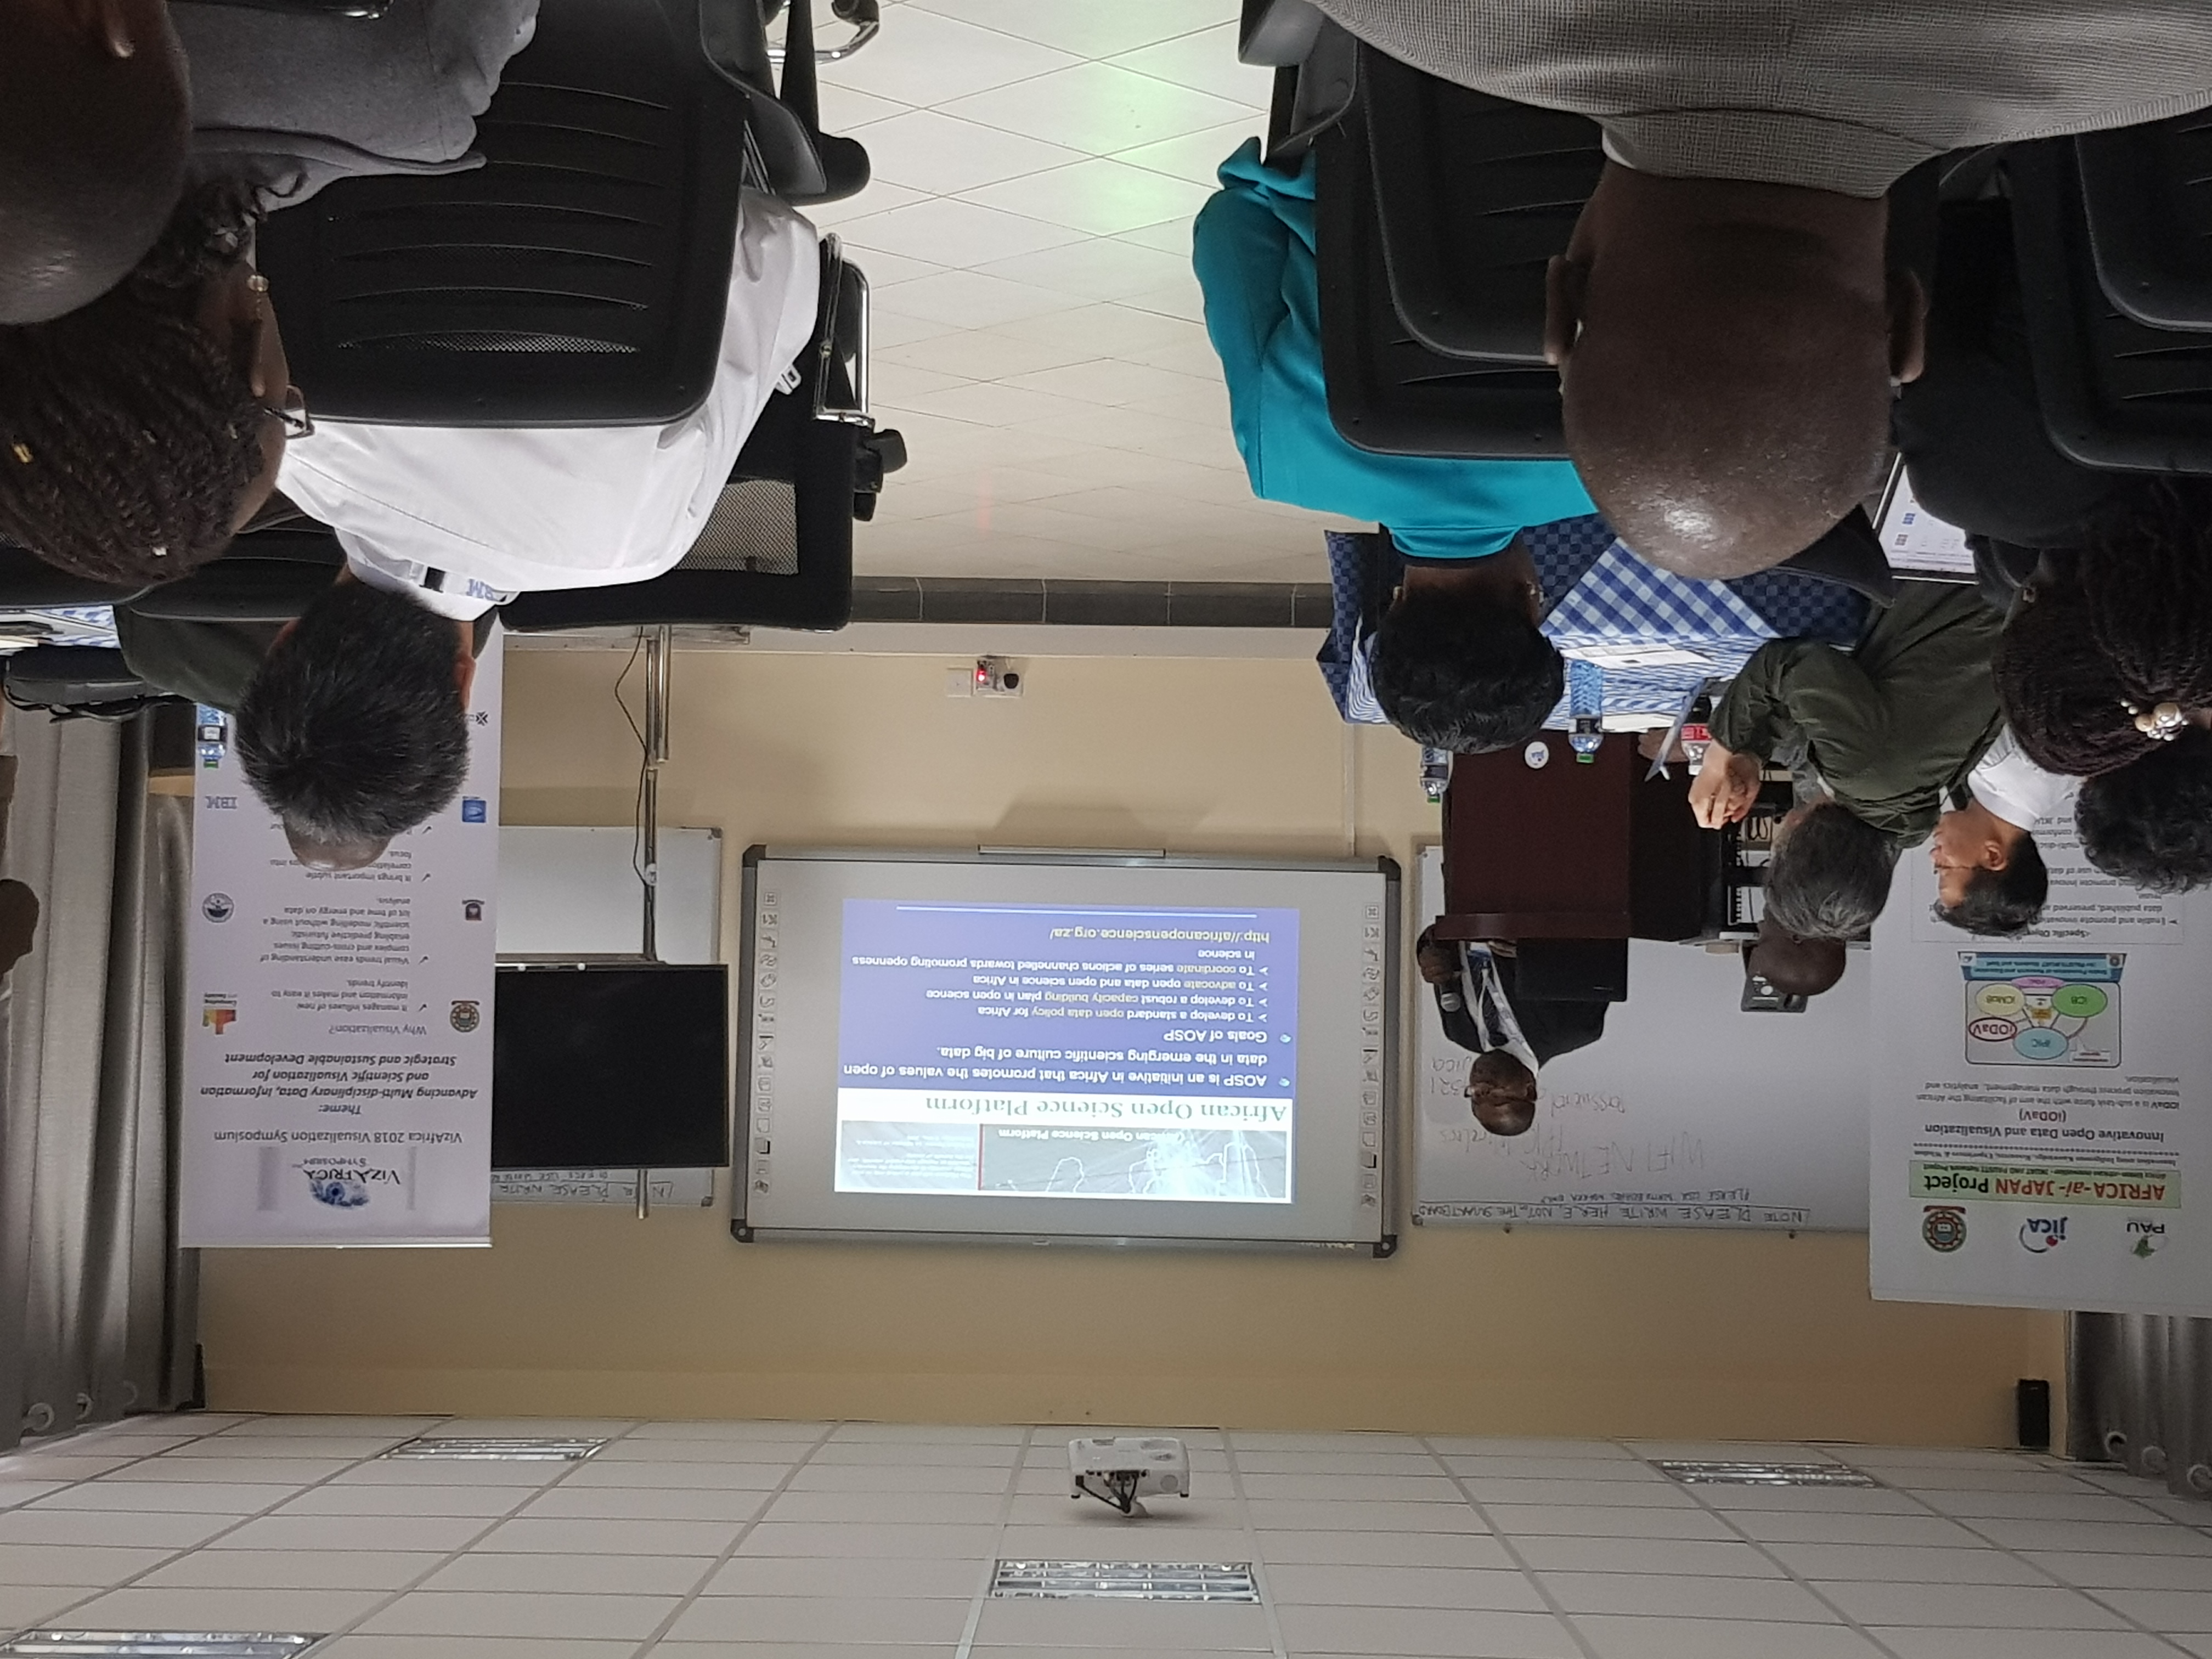
 The ICT centre of Open Data (iCEOD) has as its sole purpose is promoting data publication and data reuse through development and implementation of Open Data management. Additionally, it links other global Open Data Centres and interested parties. iCEOD through the iODaV (innovative Open Data and Visualization) sub-taskforce of the Africa-ai- Japan project whose main objective is to facilitate the African Innovation process through data management, analytics and visualization organised and hosted the VizAfrica symposium. The Communications Authority of Kenya (CAK), IBM, United Nations University Computing and Society, Kyoto University, Academy of Science of South Africa (ASSAf), Cae21.org and Lagos State University were key sponsors of this international symposium.
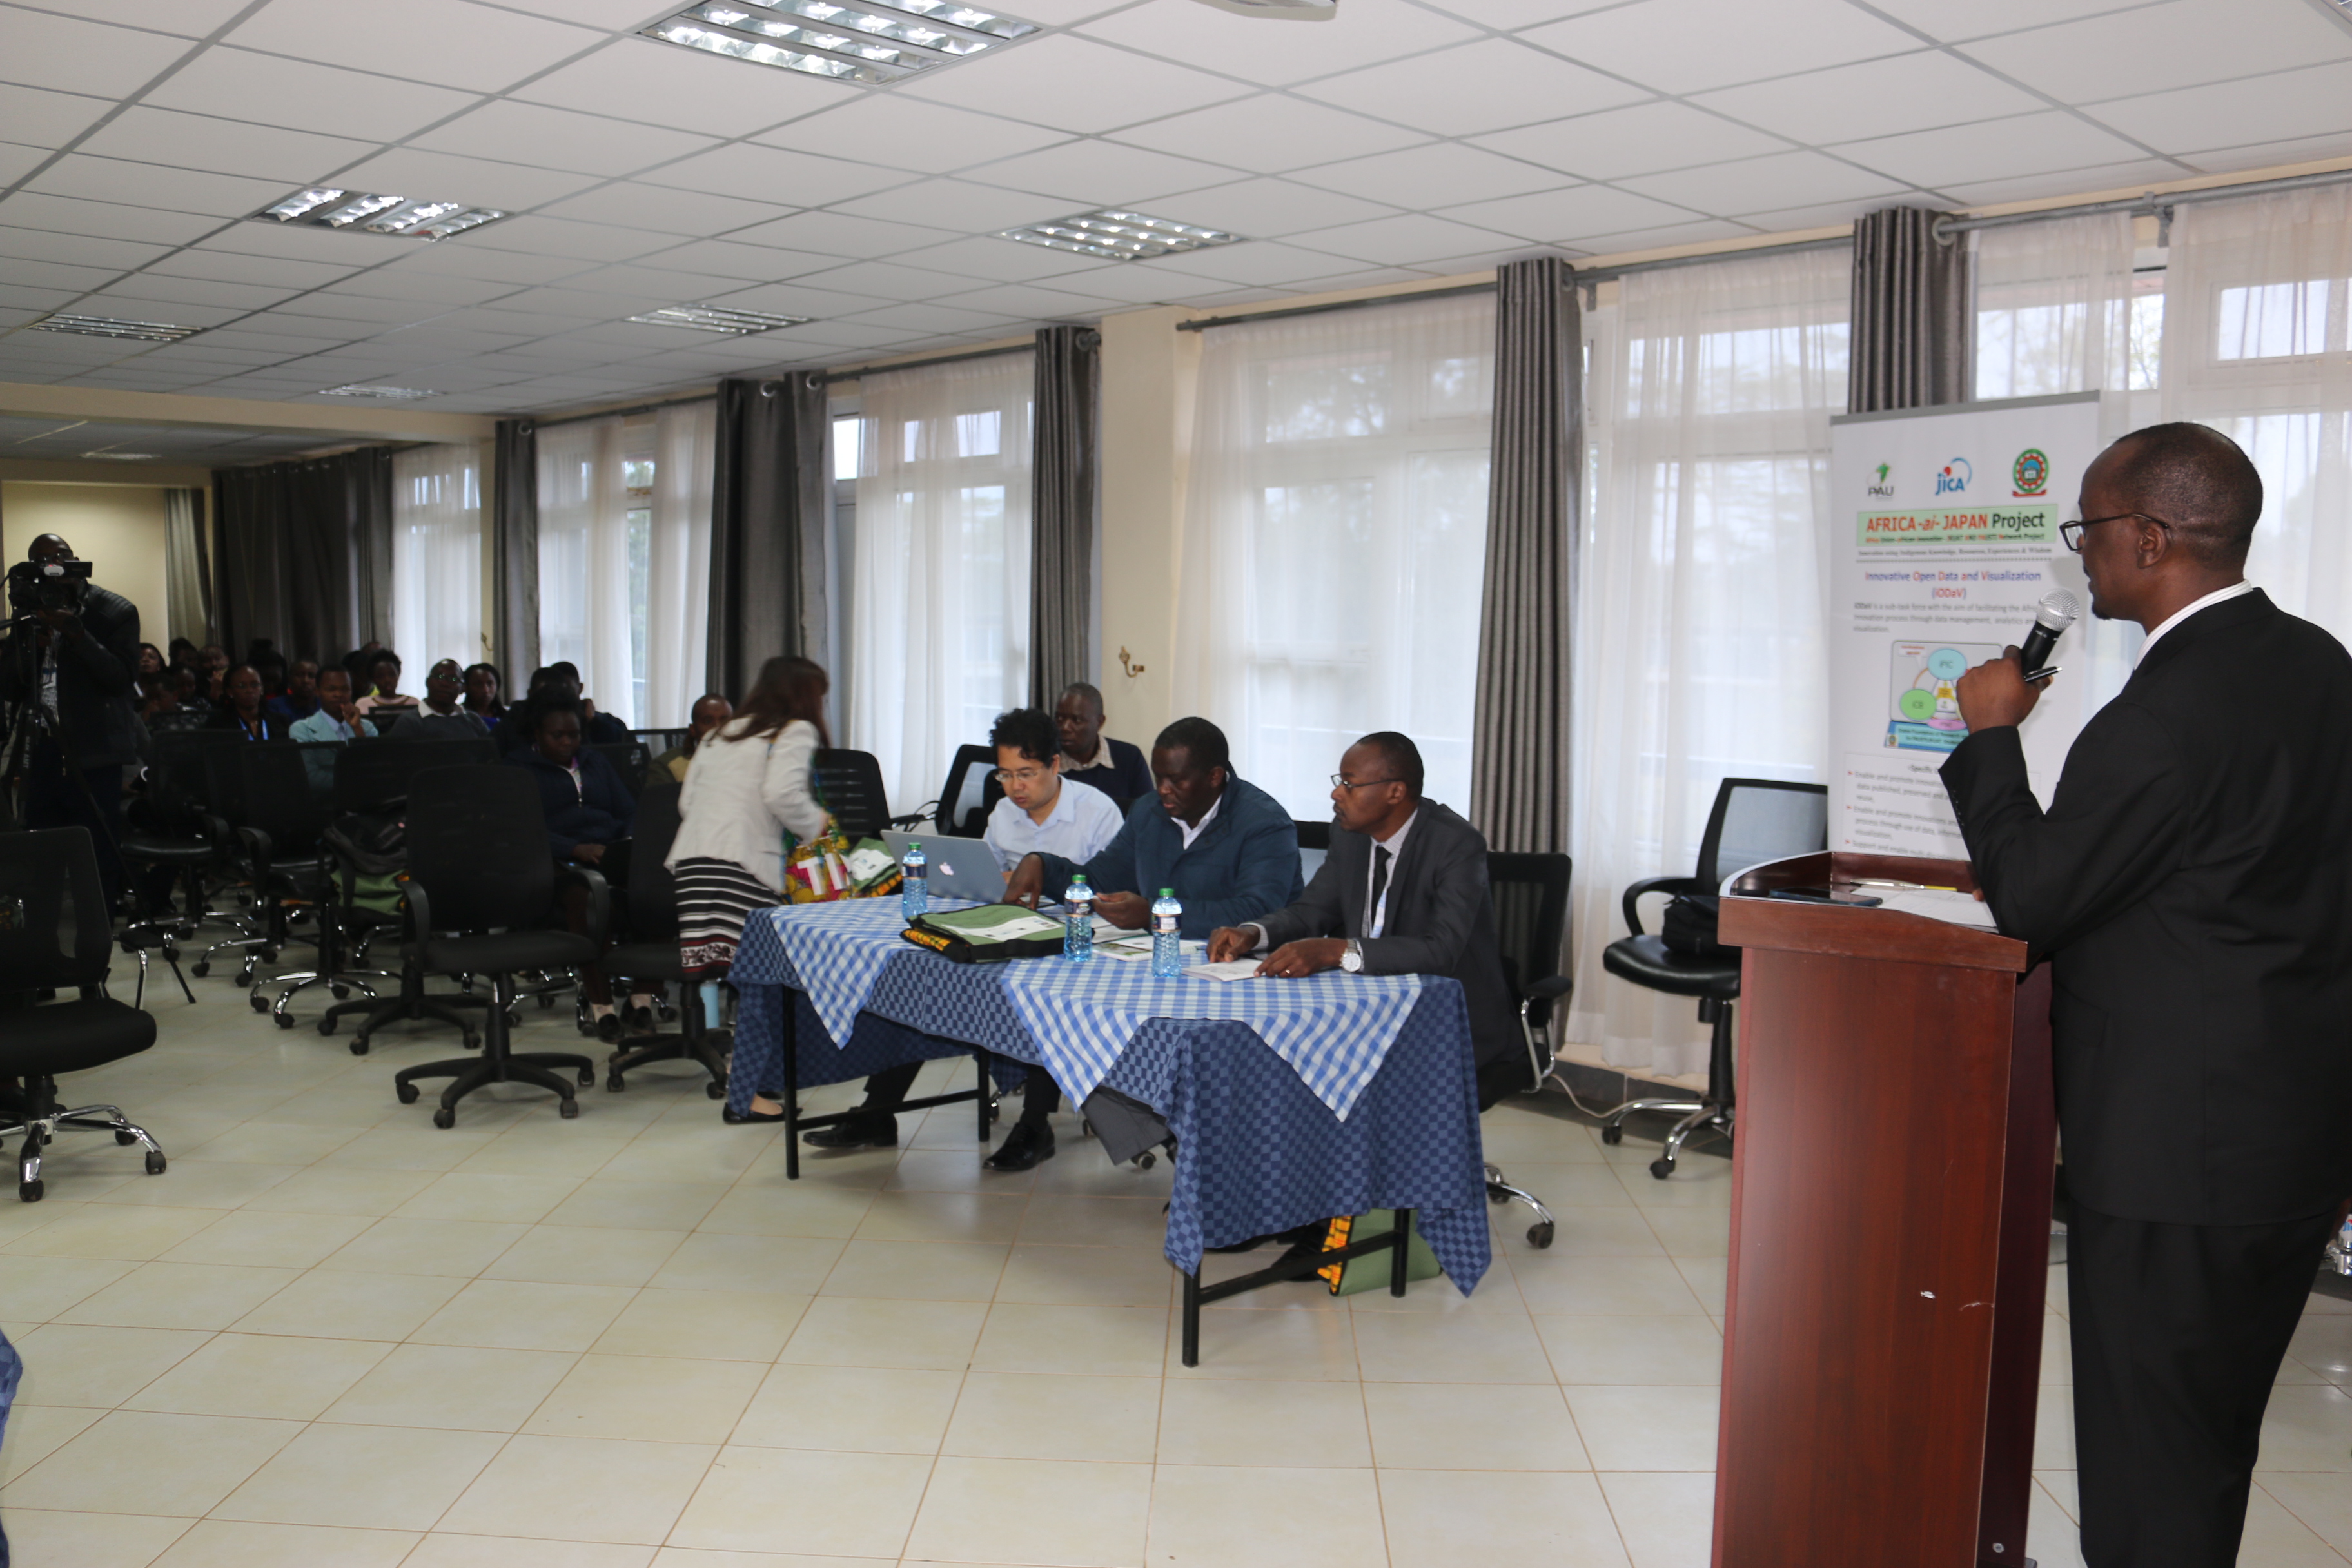
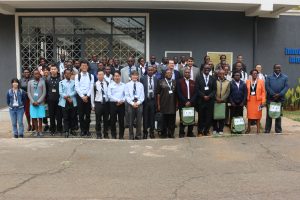
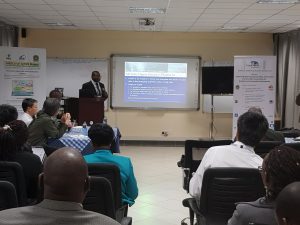
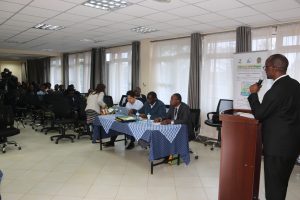 The first VizAfrica symposium was a successful event with an impressive turnout as close to 200 participants from across the globe drawn from government ministries, universities, research organizations, corporate, small and medium scale industries (SMEs), policy makers in various sectors of the economy and from international organizations attended the event from 20th to 21st August, 2018. The symposium also included a pre-conference training from 13th to 17th August, 2018. The theme of the symposium was “Advancing Multi-disciplinary Data, Information and Scientific Visualization for Strategic and Sustainable Development.”
Data visualization is conducted in various disciplines and to this end; the symposium adopted a multi-disciplinary approach involving the following six tracks:
- Manufacturing and Industry
- Policy Regulation and Strategic Management
- Logistics and Supply Chain Management
- Universal Healthcare
- Computer Graphics, Media and Animation
- Agriculture, Food Security and Nutrition
All the six sessions comprised of: research, industry, keynote speeches and panel discussions sessions.
Prof Muliaro Wafula made the following remark during the opening session “There is need to cultivate a balanced ecosystem of data and information value chain. Data, Information and Scientific Visualization provides a mirror for the supply side and lens for the demand side. VizAfrica 2018 Visualization Symposium is the beginning of one of the best approaches to better understand causality in Manufacturing and Industry; Policy, Regulation and Strategic Management; Logistics and Supply Chain Management; Universal Healthcare; Media; Agriculture, Food and Nutrition Security”.
Key note Speeches
 Prof. Xiaoru Yuan, from the Peking University in China gave a keynote speech titled ‘Data visualization for Everyone’ which demonstrated how visualization is in the middle of technology and humans. He referred to data visualization conferences held in Kyoto, Beijing and now Nairobi to emphasize how visualization is happening globally. Data visualization is relevant to researchers example in dissemination of scientific work and is also relevant to citizens in traffic jam management, discussion maps, and flood mapping. The presentation noted the existence of data visualization for non-programmers.
‘Data Visualization in the Context of World Food Programme (WFP)’ by Adrian Van Der Knap analysed WFP’s experience with data in their various countries of operations alongside how WFP collects data. Adrian emphasized that better data fuels better decision making resulting into better relationships during operations; and to this end, WFP has developed a strategy to be data driven in their decision making. The presentation noted that WFP currently uses the Optimus system to help them optimize the food basket during planning and food distribution.
Prof. Koji Koyamada from Kyoto University in Japan made a presentation titled ‘Data visualisation for Better Understanding of causality’ which acknowledged that we are living in an era of big data which demands utilisation of visualization research techniques like information visualization and graphic design including in causality which explain relationship between cause and effect, for example in the field of brain science, fluid science, communication, earth science etc. Prof. Koyamada noted that data visualization has been added to the traditional research methodology protocol.
Track Presentations
Manufacturing and Industry Track
‘A GIS based Intelligent Transportation System for Traffic Incident Management’ by Khadiala Ligono Lisah illustrated the mapping of traffic GIS data to automatically manage traffic as an efficient way of managing traffic incidents. Near real-time data was used for this research. Non-linear SVM was used for data transformation.
‘Driving Behavior Analysis Based on Vehicle OBD II Information and Location Analytics’ by Accadeius Benard Sabwa involved a practical demonstration on how OBD devices are used to manage and clear engine errors through data provided by the different sensors, including information and location data. In China, OBD devices are used by insurance companies to rate drivers if they are good or bad. Most vehicles especially German cars collect 3D data, particularly when cornering for stability. Forecasting for a car has many variables that are not constant while predictive models are based on previous driving data. Solutions for rallying cars already exist.
‘Revolutionizing the Manufacturing Industry using Business Intelligence Technology’ by Barry Okwaro provided a framework for Business Intelligence (BI) using different technologies for different areas of the framework so as to provide more flexibility and avoid vendor lock in. This approach differs from integrated software solutions e.g. SAP as it discourages buying off-the-shelf software with full integration and develop customized approaches based on the customer needs and available open source software. He noted that the kind of visualization tools and applications required for BI in manufacturing often depends on the type and nature of applications and data e.g. Tableau, PowerBI, SSRS, Sisense, QLinkView. It was noted that the competitive advantage of BI in Manufacturing allows information gathered from competitors to be put in a data warehouse before performing analytics.
‘Collision Visualization of Laser-scanned Point Clouds presentation’ by Weite Li used the nature of Ofune-hoko procession simulation laser method as opposed to the polygon method. The approach compares with commercial software e.g. polygon technology used by commercial software as it uses polygon collision detection, the street data is a cloud based solution. The presentation demonstrated how laser scanning can take data of a whole city, which is more accurate than polygon based methods.
Computer Graphics, Media Animation Track
‘Automatic Comprehension of Tweets Using Jumping Finite Automata’ by Stephen Obare,George Okeyo, Abejide Ade-Ibijola, Kennedy Ogala from JKUAT focused on the analysis, annotation and formalization of tweets using jumping finite automata specification and their importance with reference to finite automata to report on tweet variations.
‘Interactive Visualization System of Precipitation’s Probability by Using Percentage Area Graph’ by Lei Puwen from Kyoto University, Japan delved in visualization of water level forecasting using deep learning with an aim of preventing the results of flash flooding in small rivers. Visualizing the results with time series of environmental factors were the main inputs. Linear regression was also used in the research. Real data was converted to binary data using Gauss distribution.
‘Separation of Overlapping Image Objects Using Morphological Operations’ by Patrick O. Ajwang – JKUAT focused on separating overlapping images using morphological operations and was aimed at mechanizing agriculture for identification of mature flowers through separation of overlapping objects through image acquisition- pre-processing-segmentation-feature extractions and classification. One defines the size and shape of extraction from source code, using neighbouring matrices, trial and error, however this is difficult for irregular shapes. The size of erosion for dilation can be automated instead of trial and error.
Constance M. Ngila and Catherine W. Wangari presentation titled ‘Color Impact on the Perception of the Emotions Portrayed in 3D Animations’ entailed capturing emotions from clients using colour intensities in videos thus different colours, contrasts and lighting. This was aimed at studying their effects on mood and emotion. It was suggested that cultural beliefs, gender and age should also be considered in the study alongside other data collection methodologies and try automating them.
Yuki Ueno from Kyoto University, Japan presentation on ‘Classification of Task Performance during an Evaluation of Visualization method based on physiological Signals’ considered EEG, pattern of brain wave and eye blink in young adults. Future work will include how heart rate is affected when a task takes very long or short time to complete.
‘Realtime DHIS2 Data Capture, Integration and Operability as a Potential Driver towards Health Data Analytics, Health Intelligence and Visualisation for Mother Child Health Data in Kenya’ by Sarah Waiganjo , Muliaro Wafula, Simon Karanja from JKUAT focused on challenges in capturing data at health facilities in public hospitals. Most data is keyed in registers and aggregated later causing delays in decision making. It emphasised the need to provide real time accurate data.
‘A Computational Evaluation of Eye-track Measures in Group-in-A-Box’ by Nozomi Aoyama Yuki Ueno, Koji Koyamada from Kyoto University, Japan emphasized the need of effective use of good visualization although it is difficult to know if a good layout is good. The presentation aimed at making a guideline for referring to eye track measures effectively to enable researchers reach findings easily and quickly. The analysis is used for eye tracking data as a confirmation and requirement for further analysis- visual analytics, computational methods.
‘A method for Extracting Data Points from an Image of a Plotted Graph’ by Lincoln Kamau, Philip Kibet, Christopher Maina, Robert Macharia from JKUAT, Kenya noted that data in graphs can be deceiving. To address this data is converted to greyscale using a threshold value followed by detecting the value plot and scaling the detected values depending on the quality of the graph in use. Accuracy is tested through manual testing that involves use of original data and output data of experiment. This was done on black and white images.
‘Visualization of Tsunami Simulation Data using Multi-dimensional transfer functions in HSVA Color Space’ by Ikuya Morimoto, Satoshi Nakada, Kyoko Hasegawa, Liang Li, Satoshi Tanaka from Ritsumeikan University, Japan aimed at finding ways to minimize effects of Tsunami through visualizing tsunami in the Nankai Trough earthquake using fusion visualization and the amount of salinity change and flow velocity to save aqua-culture. The method used was the multi-dimensional transfer functions in HSVA colour space thus hue saturation and brightness as compared to hue and brightness which gives clearer pictures about a tsunami. This simulation can also be applied to rivers and lake.
‘A Big Data Analytics and Visualization Model for Enhancing Security Within Smart Cities: A Case Study of Nairobi Metropolitan Area’ by Geoffrey Wekesa Chemwa from JKUAT focused on the need for automatic facial recognition to supplement human efforts in this era of terrorism using Hadoop framework which is efficient considering that facial recognition library has advanced and evolving quickly.
‘The Psychological Perception of Matatu Graffiti on Passenger Attraction’ by Michael S. Wafula and Joseph J. Musakali – Moi University, Kenya highlighted the impact of graffiti on our minds and the acceptance of graffiti as an art. Graffiti and psychology are linked in that people usually form an image out of an image. Graffiti is a concept of persuasion in the transport industry. Results from the study showed that youth loved graffiti that mainly contained celebrities, political and religious pictures. Public transport vehicles in Kenya known as Matatu, their owners spend a lot of money to put graffiti while people like or dislike graffiti depending on their age, beliefs and the likes. Graffiti is a source of livelihood but can also be a menace hence the need for institutionalizing graffiti policy/law to promote graffiti in a regulated format.
Panel Discussions and Way Forward:
The VizAfrica symposium concluded with a closing ceremony in which it was agreed by acclamation that:
- Visualization is diverse and we should all be part of it and nurture it so as to make each other better.
- The VizAfrica symposium will be held annually.
- A summer program for visualization lasting 2 to 3 weeks should be instituted. This can then progress into certificate, diploma, degree, post graduate and exchange programs.
Program Booklet
Keynote speakers booklet
Combined abstract
Vizafrica booklet
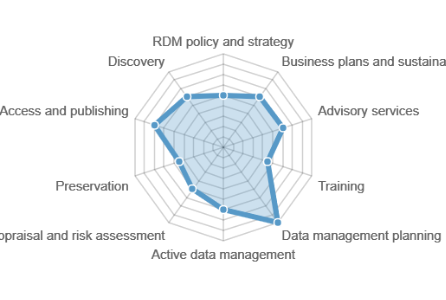 Institutions now have a new means at their disposal to aid them in assessing their research data management initiatives, the Evaluating RDM Tool.